Intro to tables
In Honeycode, tables are the motor of your app—they are where all your data is stored. Tables have some similarities to spreadsheets, for example they look similar and support some of the same functions and formulas.
But, in terms of power, efficiency, and elasticity, tables in Honeycode tend to behave more like a database.
Tables can be used to:
- Filter, sort, summarize, and link data
- Preserve data integrity
- Trigger automations and run calculations
- Power your apps
How to access tables
Once you sign in to Amazon Honeycode, you’ll go to your Dashboard . This is where you’ll find all your workbooks and apps, whether you’re an owner, collaborator, or app user.
To open Tables, select a workbook from the list or go to Create workbook in the upper right. You’ll find several options, including a number of templates—and they all will lead you to tables.
Take a quick tour
Let’s take a look around to get you oriented with tables in Honeycode.
- Your table name is in the upper left—you can rename it directly by placing your cursor in this area
- Clicking on the Tables icon to the left expands a panel showing your workbook and its associated tables
- Select an existing table from the tables picklist, or click on one in the tables list
- To add a new table , click the [+]
In the central area you’ll see something that looks, not surprisingly, like a table. Pretty familiar, right?
A table is composed of rows and columns. Tables often represent real-life scenarios, where each row represents a thing, like Tasks, and each column represents an attribute of the thing, such as Assignee, Due Date, or Status.
While the concept of a table may be simple, the possible combinations and applications of what tables can do in Honeycode are pretty impressive. Our Data Modeling 101 article helps you visualize how your tables work together to bring your apps to life.
Your data in tables
Your Honeycode app may be powered by a single table or it may be powered by many tables that work together. When you build an app, it can show all the data in a table, or you can use any number of Honeycode functions to control what users see.
- Filters hide data in a table
- Rowlinks let you see an entire row of data from a single cell
- Summaries provide ways to visualize data
- Formulas simplify complex queries
Formula help
Honeycode automatically helps you write formulas flawlessly. As you type, Honeycode suggests functions, autocompletes table and columns names, shows variables, and helps with proper syntax.
To access, simply type the [=] sign in a table cell. Formula help is also available to assist you inBuilder and Automations.
Wizards
Honeycode Wizards are shortcuts to help you make apps and quickly manage data. Click the Wizards icon in the toolbar to open the main menu.
Table formats
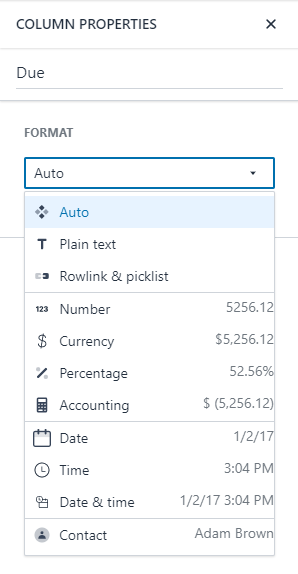
Tables support standard formats, such as numbers, currency, accounting, and date & time. But you’ll also notice some unique Honeycode formats, like rowlinks and contacts.
To open the formats panel, click into the column to format and click on the Format icon in the toolbar.
Table styling
All the effort you may have invested styling spreadsheets in the past? Forget about it. There’s really no need to style your tables in Honeycode since they essentially act as a database—instead your app is the collaborative touchpoint for your team.
You can put your design chops to work later in the Builder. If you would like to style your tables however, you can click the Style icon in the toolbar.
Your tables in an app
You don’t need to master data modeling to get started on your first Honeycode app. Just put some data in a table and you’re ready to start making an app in Builder.
| Was this article helpful? |
|---|
- Yes
- No
0 voters


