Supercharge your data
The use of filters is common in many spreadsheet and database applications—and they function similarly in Honeycode. Their purpose is to sort and extract data to analyze and organize.
At a more granular level, a filter reduces a table from all of its rows to only some of its rows.
When building apps in Honeycode, we use filters to limit the data shown on a particular screen or to a particular user, for example, showing only “active” projects or only tasks assigned to “me.”
Applying filters
In tables , you can apply filters to your data by clicking on a column header to access sort and filter functions.
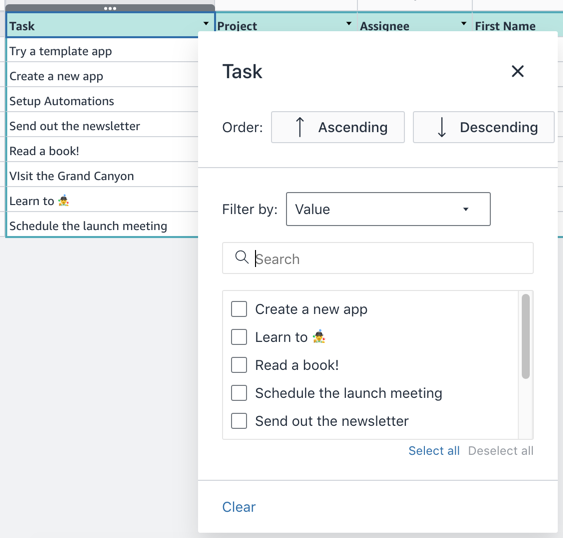
When you apply filters this way, they’re simply a visual change to the data displayed—they don’t affect the underlying data. So, if two people have a Honeycode table open simultaneously, and one applies a filter to the table, the other user won’t see any change in their view.
Using filter formulas
A more advanced use of filters is in formulas. The filter function, FILTER() , takes a table and a condition, and returns any rows from the table that match the condition.
In Honeycode, you can even store filters in a cell. Imagine you have a table of projects, like below.
You can type a formula into a cell, such as:
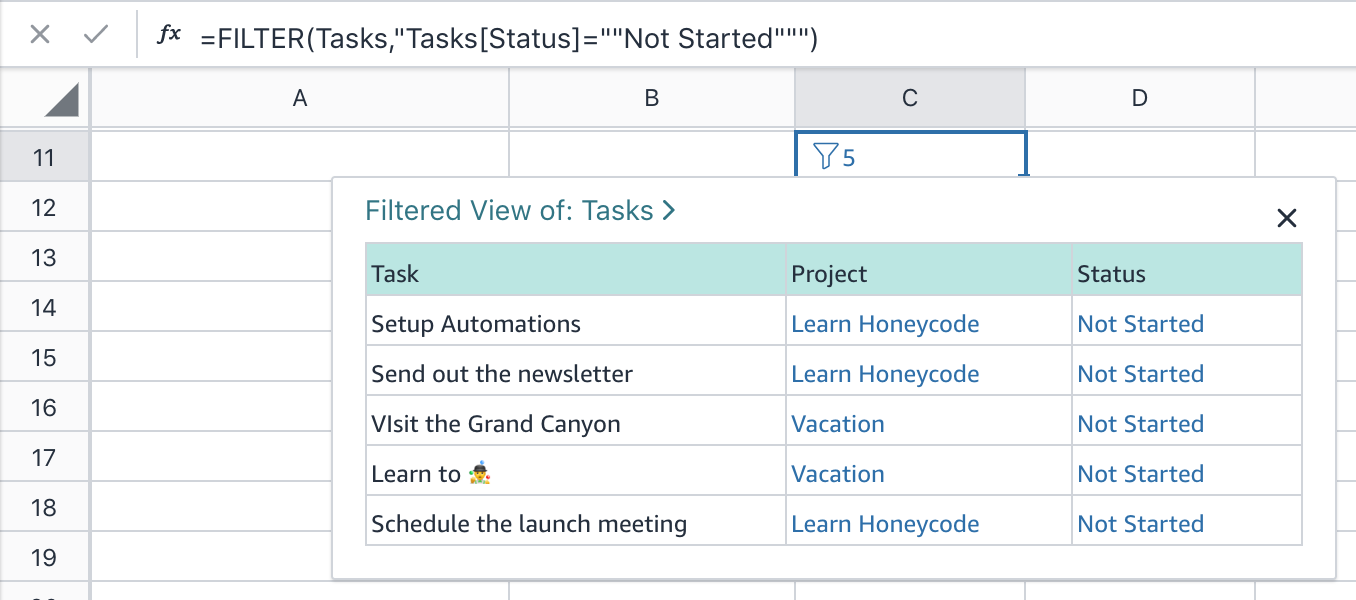
=FILTER(Projects, "Project[Status] = ""NotStarted""")
The result will be displayed as a blue filter icon with a number. The number shows how many rows were returned from the Project table.
Clicking on the filter link will show you all the tasks with a “Not Started” status in the Projects table.
Linking tables with filters and rowlinks
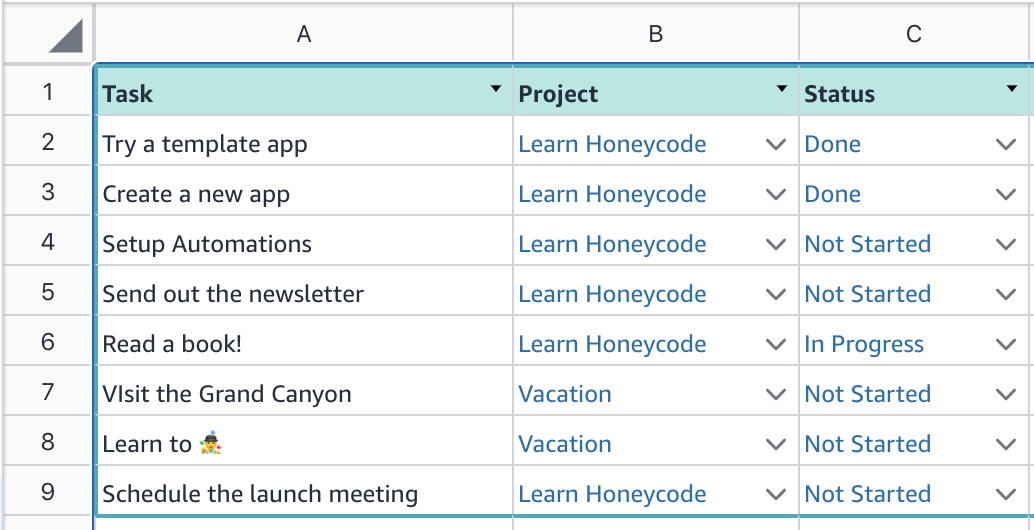
In Honeycode we have a super unique feature called a rowlink. A rowlink is a format that stores an entire row of data in a single cell. Rowlinks are displayed as blue text with a chevron to the right, as in the Project column below. Clicking on a rowlink lets you view an entire row of data.
Filters and rowlinks are the key mechanisms used to link tables. Remember the Tasks table? You’ll see that it has rowlinks to a Projects table, like the one below.
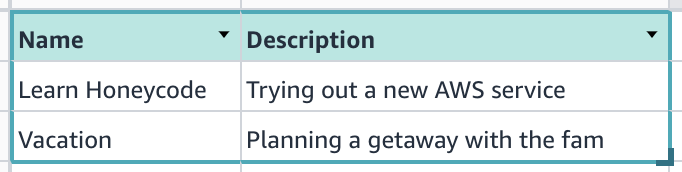
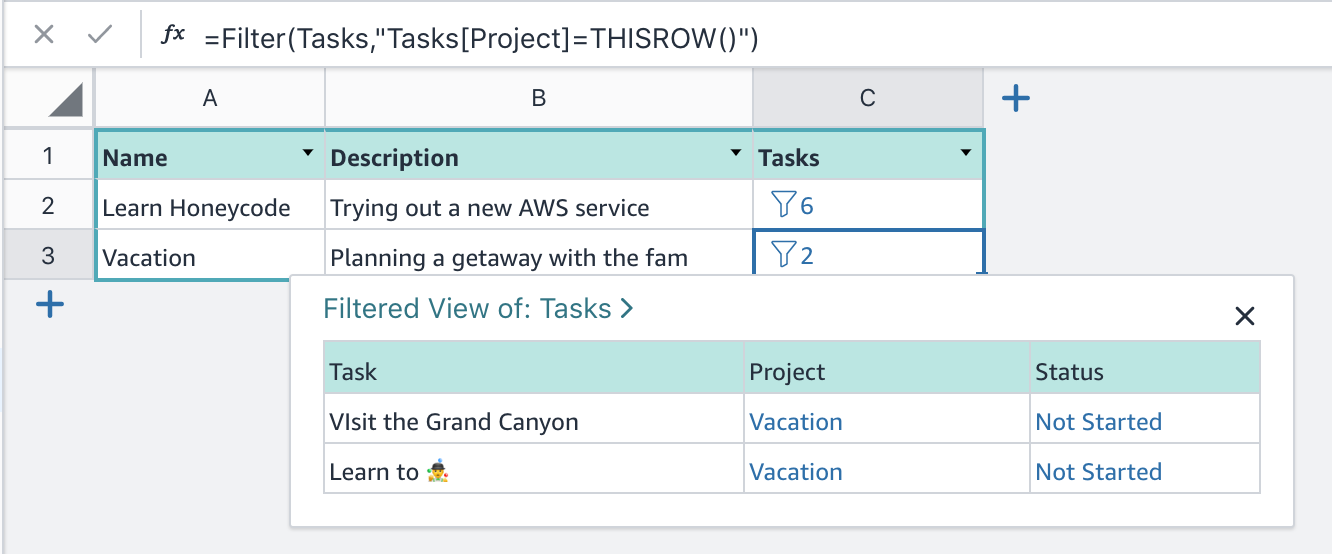
Now, let’s say we’d like a way to reference from inside the Project table how many tasks are linked to a project. Simply add a new column, then enter the formula:
=FILTER(Tasks, "Tasks[Project]=THISROW()")
Now, we have a filter in the Tasks table.
Wait... there’s more. The filter result is not just the count of rows, you can actually see all the rows when you click on the filter. Now that's what we mean by supercharge your data.
A deeper dive into the filter formula
=FILTER(Tasks, "Tasks[Project]=THISROW()")
Let's break the formula down, piece by piece.
FILTER(Tasks,
Simply says start with the Tasks table and give me all rows that match the condition that follows.
Tasks[Project]=
This is the start of the matching condition. In the Tasks table, we want to check the column named ”Project" and see what it’s equal to.
THISROW()
Remember that we are adding this column to the Project table, so each row of the Project table will contain this function.
Since the Task table contains a column with rowlinks, we can check to see if the rowlink is linked to the same row as in our project table.
To learn more about how to add a filter in your app, check out this article.
| Was this article helpful? |
|---|
- Yes
- No
0 voters