I have a Task table with fields project,task, assignee and Totalhours. Then another task detail table called Hours with project, task, assignee, hours, tmStart, tmEnd . For a project task I can have multiple assignee and hour for each. How do I total up the hours from the Hours table l into Task.TotalHours column. I tried =SUM(filter(hours,"Hours.Task[Assignee]=%",[Assignee])[Hour]) does not work. I need to sum assignee hours in hours table by project.task.assignee.hour.
Hi @aann-1381, so glad you are starting to build, glad to provide some help.
I think you had some problem with the Hours.Task notation and combining attributes. I've tried to replicate your scenario and here is what I got:
Tasks table. I've added a few "summary" fields:
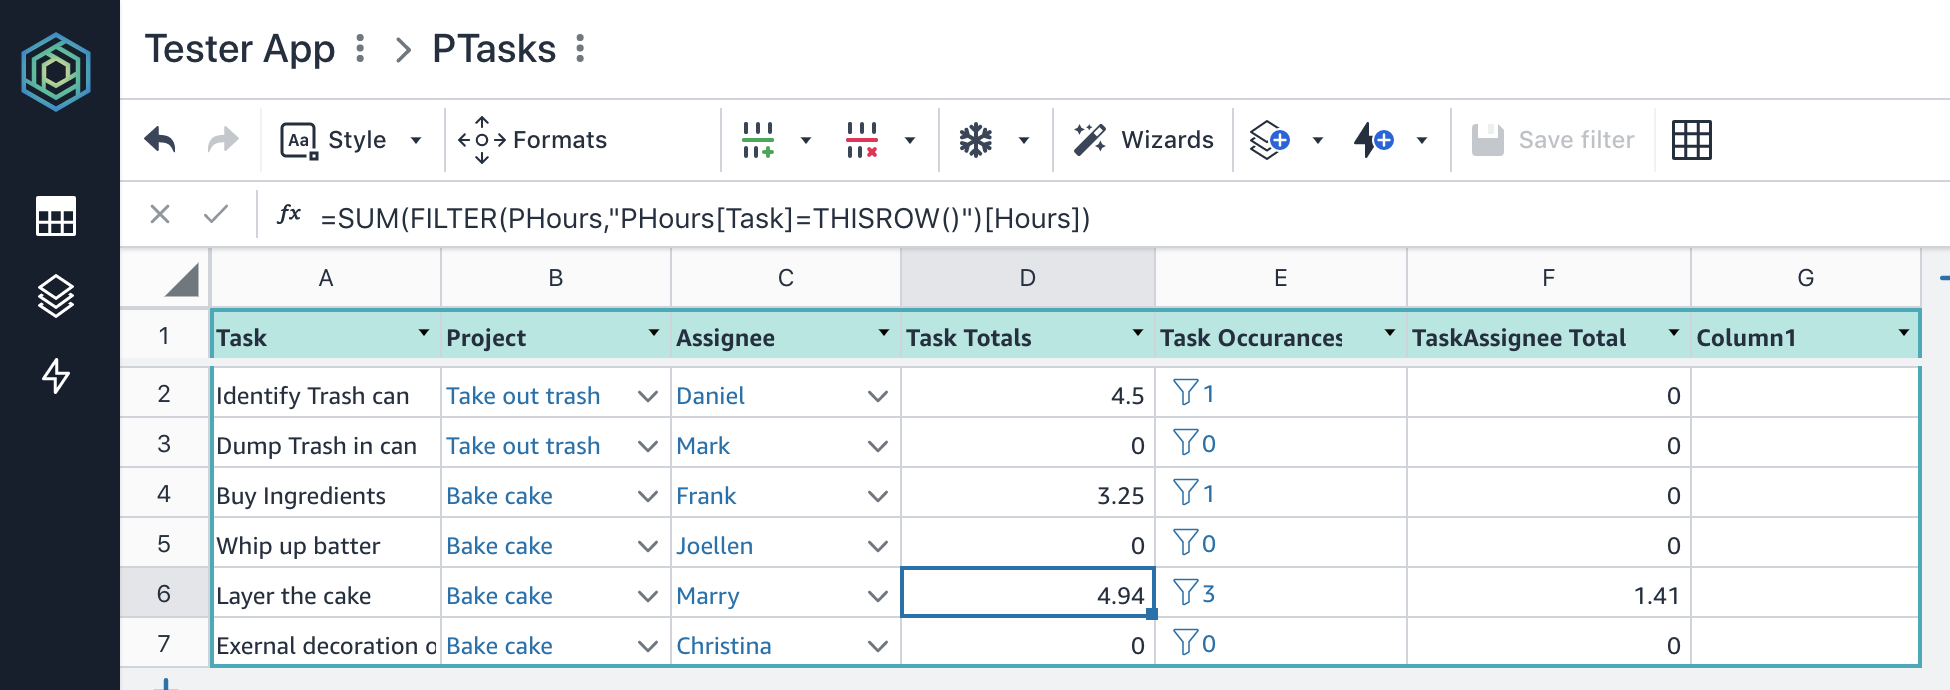
Task Totals =SUM(FILTER(PHours,"PHours[Task]=THISROW()")[Hours])
TaskAssignee Total =SUM(FILTER(PHours,"PHours[Assignee]=THISROW()[Assignee] AND PHours[Task]=THISROW()[Task]")[Hours])
Be careful that the TaskAssignee only records if someone actually worked on the task they were assigned, that's why there are so many zeros in that column. In my case only Marry actually worked on the assigned task and only her time is being reported (1.41 units).
And the Hours table is straight forward:

Hope this helps,
DT.
Hi DT,
1.Appreciate your taking time to replicate and reply. Your syntax, THISROW() is gets red squiggles. Is this because i already have a rowlink attached?
2. Got it working, using this: =SUM(filter(hours,"Hours[Assignee]=% and Hours[Task]=%",[Assignee],[Task])[Hour]).
Is there document with all the functions?
3. Hours table has an assignee not in the task table. That is, anyone can spend time on a task, so how can I roll up the assignee from hours to task table? That means task table can contains tasks that are directly entered, and Tasks and assignee rolled up from Hours table. It should be easy to for Hours update to insert or update a row into Task, while allowing tasks to entered directly via the app. I wonder if this is possible.
Thanks -AN
hi @aann-1381,
Good questions, glad this helped somewhat. Here are the answers to your questions:
-
Please post the screenshot so we can look at the formula and the red squiggle/error. If you are just seeing red squiggles under the words like this, but it works:
that is just the spell checker on your browser not recognizing the words as english. If it's something else let us know. -
There are some examples that show the use of AND as well as function within a function here: Filter( ) It's not exactly SUM(FILTER(....)) but similar.
-
You have two options A) DIY, and B) use the Summary Wizard in the table view. In both cases the effect is the same. Here they are:

A) Do it Yourself
A.1 - Create Two new columns in hour Hours table called, Instances and Total
A.2 - Format them as "Auto" with this formula for the entire column:
Instances =FILTER(PHours,"PHours[Task]=[Task] AND PHours[Assignee]=[Assignee]")
(this finds all the instances that have the same task and assignee, essentially a grouping or pivoting function)
Total =IFERROR(SUM([Instances][Hours]),0)
(this sums up the hours from the Instances filter operation)
You can combine these and use only one column with a function like this:
=SUM(FILTER(PHours,"PHours[Task]=[Task] AND PHours[Assignee]=[Assignee])[Hours])
but breaking them up shows up what is happening a bit nicer IMHO.
In the end you will get something like this.

Notice how the Instance and Total are always the same for every occurrence of "Marry" and "Layer the cake"; also they appear twice in this case. This is not desirable in most displays, that's where the second option comes in handy.
B) Summary Wizard
This wizard creates a proper pivot table and removes duplicates. Here is what you do:
B.1) View the Hours table
B.2) Click on the wizards and choose Dashboards >> Summarize Table
B.3) Follow the prompts like so:

and so:

When you are done you end up with a Pivot table like so:
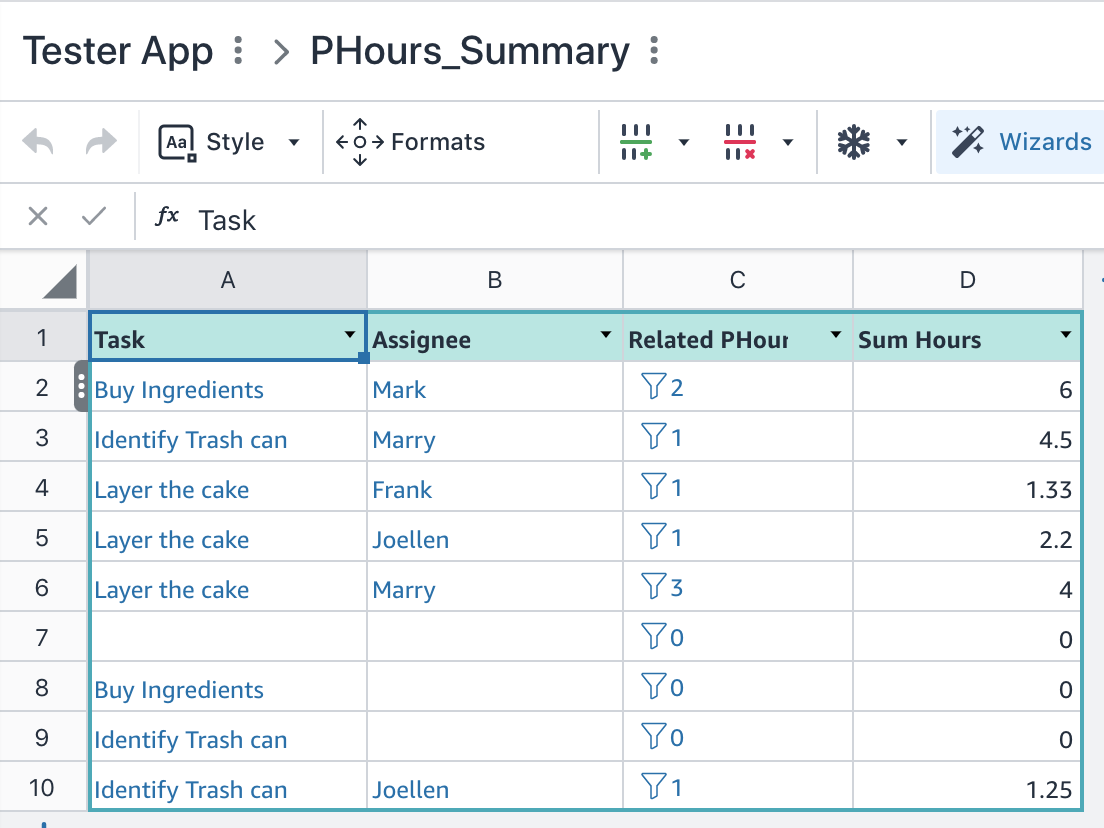
Ignore in the view the blank row (7) and the rows with only task in them (8,9); they are side-effects of how "eager" the pivot table is to report the totals, it even does it before you've completely entered the full record in the hours table. You can also ignore these in the screen when you show all the hours worked, you can only show those where Total > 0.
(I will file this as a feature request to clean up the empty rows)
Hope this helps.
Cheers,
DT.